
ICT Unicorn Strategy Explained: How to Identify and Trade It

The ICT Unicorn strategy allows traders to predict sharp price movements using Inner Circle Trader (ICT) concepts. This article explains the ICT Unicorn strategy, breaker blocks, fair value gaps, how to trade the strategy, and how to avoid bad trades with the strategy.
What is the ICT Unicorn?
The ICT Unicorn is a trading strategy that aims to predict sharp price movements in any market, including stocks, crypto, forex, and futures. The strategy uses two concepts from ICT’s teachings: Fair Value Gaps (FVG) and Breaker Blocks (BB). FVGs are imbalances in the market that occur when price jumps up or down extremely fast. Breaker Blocks are structure changes that occur when an order block fails. To properly understand and execute this strategy, you must understand these concepts.
Breaker Blocks (BB)

A Breaker Block (BB) is an invalidated Order Block (OB). These zones act similarly to broken resistance levels turning into support. When a bearish order block is invalidated, it turns into a bullish breaker block. When a bullish order block is invalidated, that zone turns into a bearish breaker block. These zones can be used to spot potential market reversals and provide trade entry opportunities.
A bullish breaker block can be identified by looking for the following pattern: a low (L), followed by a high (H), followed by a lower low (LL), followed by a higher high (HH).
A bearish breaker block can be identified by looking for the following pattern: a high (H), followed by a low (L), followed by a higher high (HH), followed by a lower low (LL).
Fair Value Gaps (FVG)
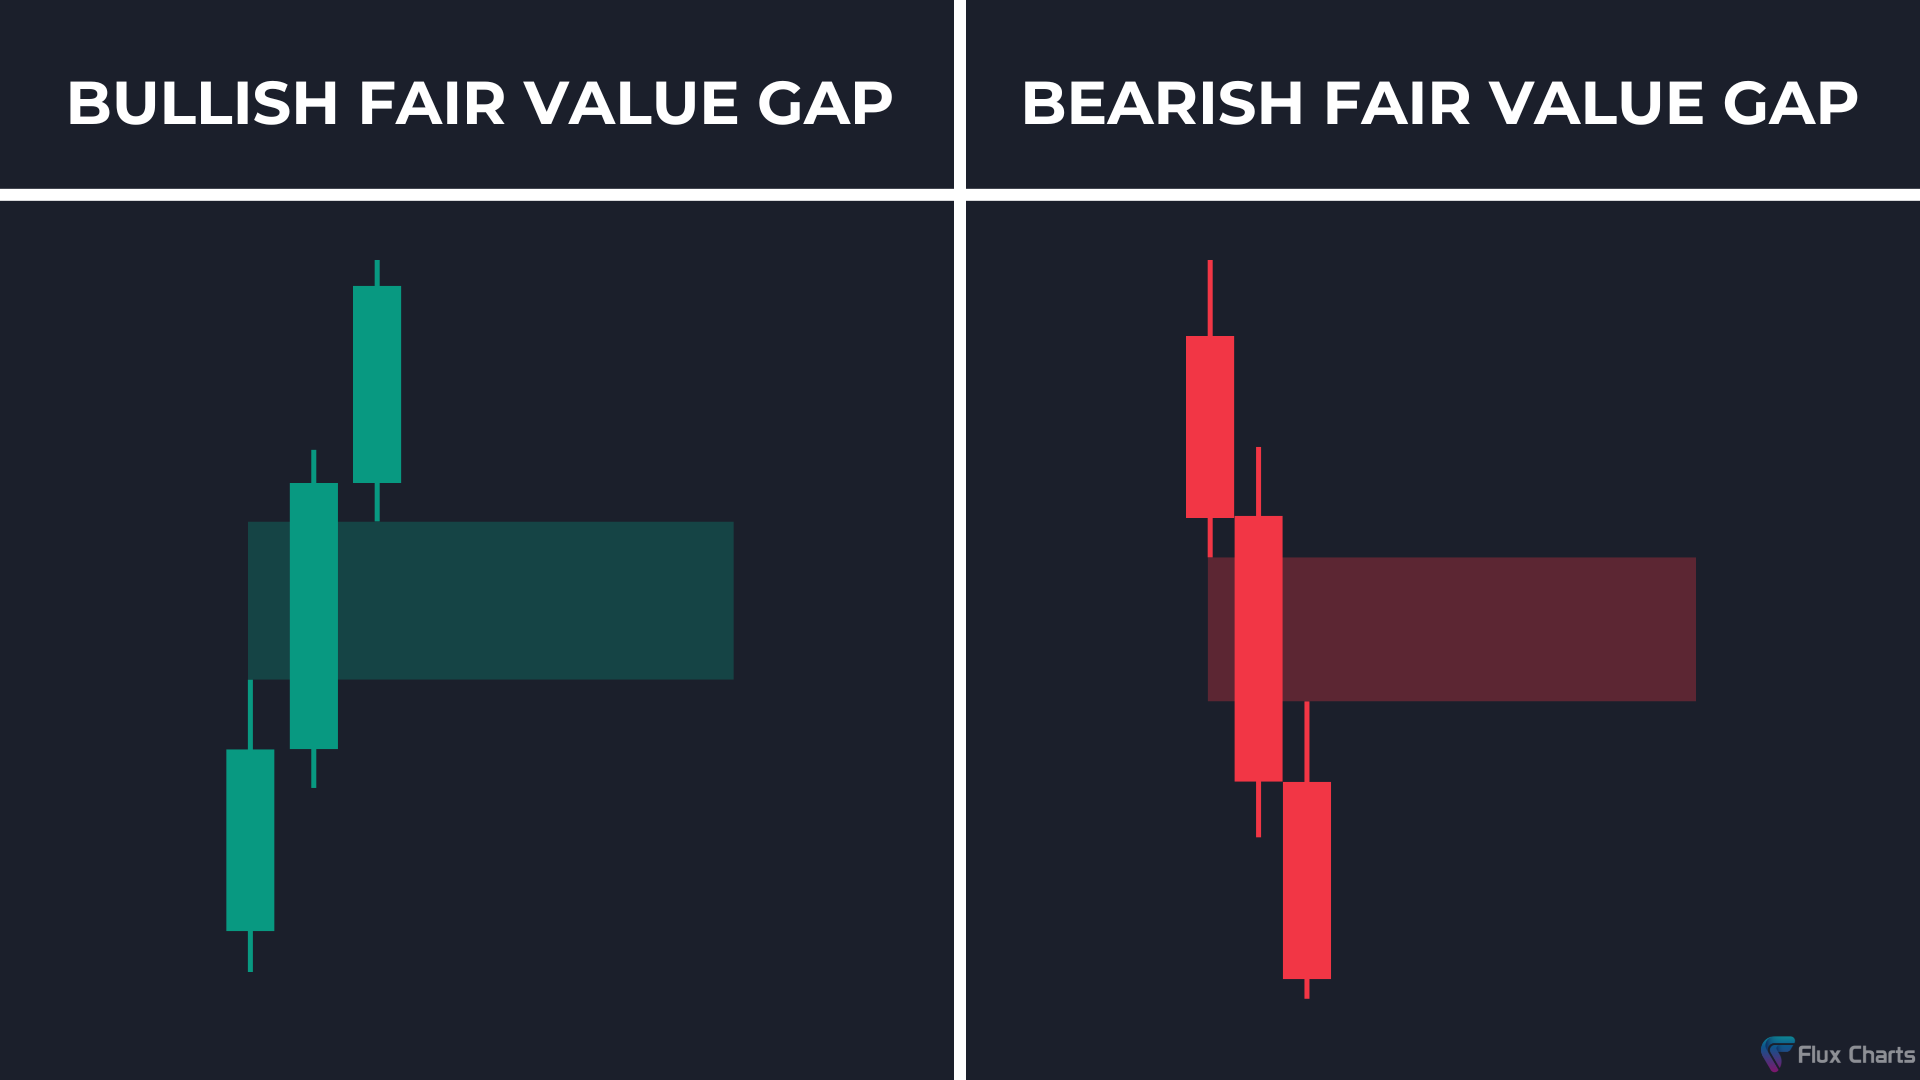
A Fair Value Gap (FVG) is a three-candlestick pattern. When candle one and candle three’s wicks do not overlap each other, the gap between these wicks on the second candle is considered an FVG. These areas are formed when price jumps up or down quickly, creating an imbalance between buyers and sellers. When price retraces to these zones, traders can use them as entry points in the market.
There must be three consecutive bullish candles for a bullish fair value gap. The high of the first candle should not overlap the low of the third candle.
There must be three consecutive bearish candles for a bearish fair value gap. The low of the first candle should not overlap the high of the third candle.
How To Identify the ICT Unicorn Setup
The ICT Unicorn setup is simple to identify. It’s a fair value gap that overlaps a breaker block. The easiest way to find this setup is to mark out all the breaker blocks on your chart. Then, check if there’s a fair value gap overlapping any of those breaker blocks.
Bullish Setup

To identify a bullish ICT Unicorn setup, look for a bullish breaker block that is overlapped by a bullish fair value gap.
Bearish Setup

To identify a bearish ICT Unicorn setup, look for a bearish breaker block that is overlapped by a bearish fair value gap.
How to Trade the ICT Unicorn Strategy
Long Trades: Once price retraces to your bullish fair value gap, you can take a long entry, setting your stop loss below the bullish breaker block and taking a 1:2 risk-to-reward ratio trade.
Short Trades: Once price retraces to your bearish fair value gap, you can take a short entry, setting your stop loss above the bearish breaker block and taking a 1:2 risk-to-reward ratio trade.
Long Trade Example

In this example, there was a bullish ICT Unicorn setup: a bullish breaker block with an overlapping bullish fair value gap. Once price retraces to the bullish fair value gap, you can take a long entry, setting your stop loss below the breaker block and taking a 1:2 risk-to-reward ratio trade.
Short Trade Example
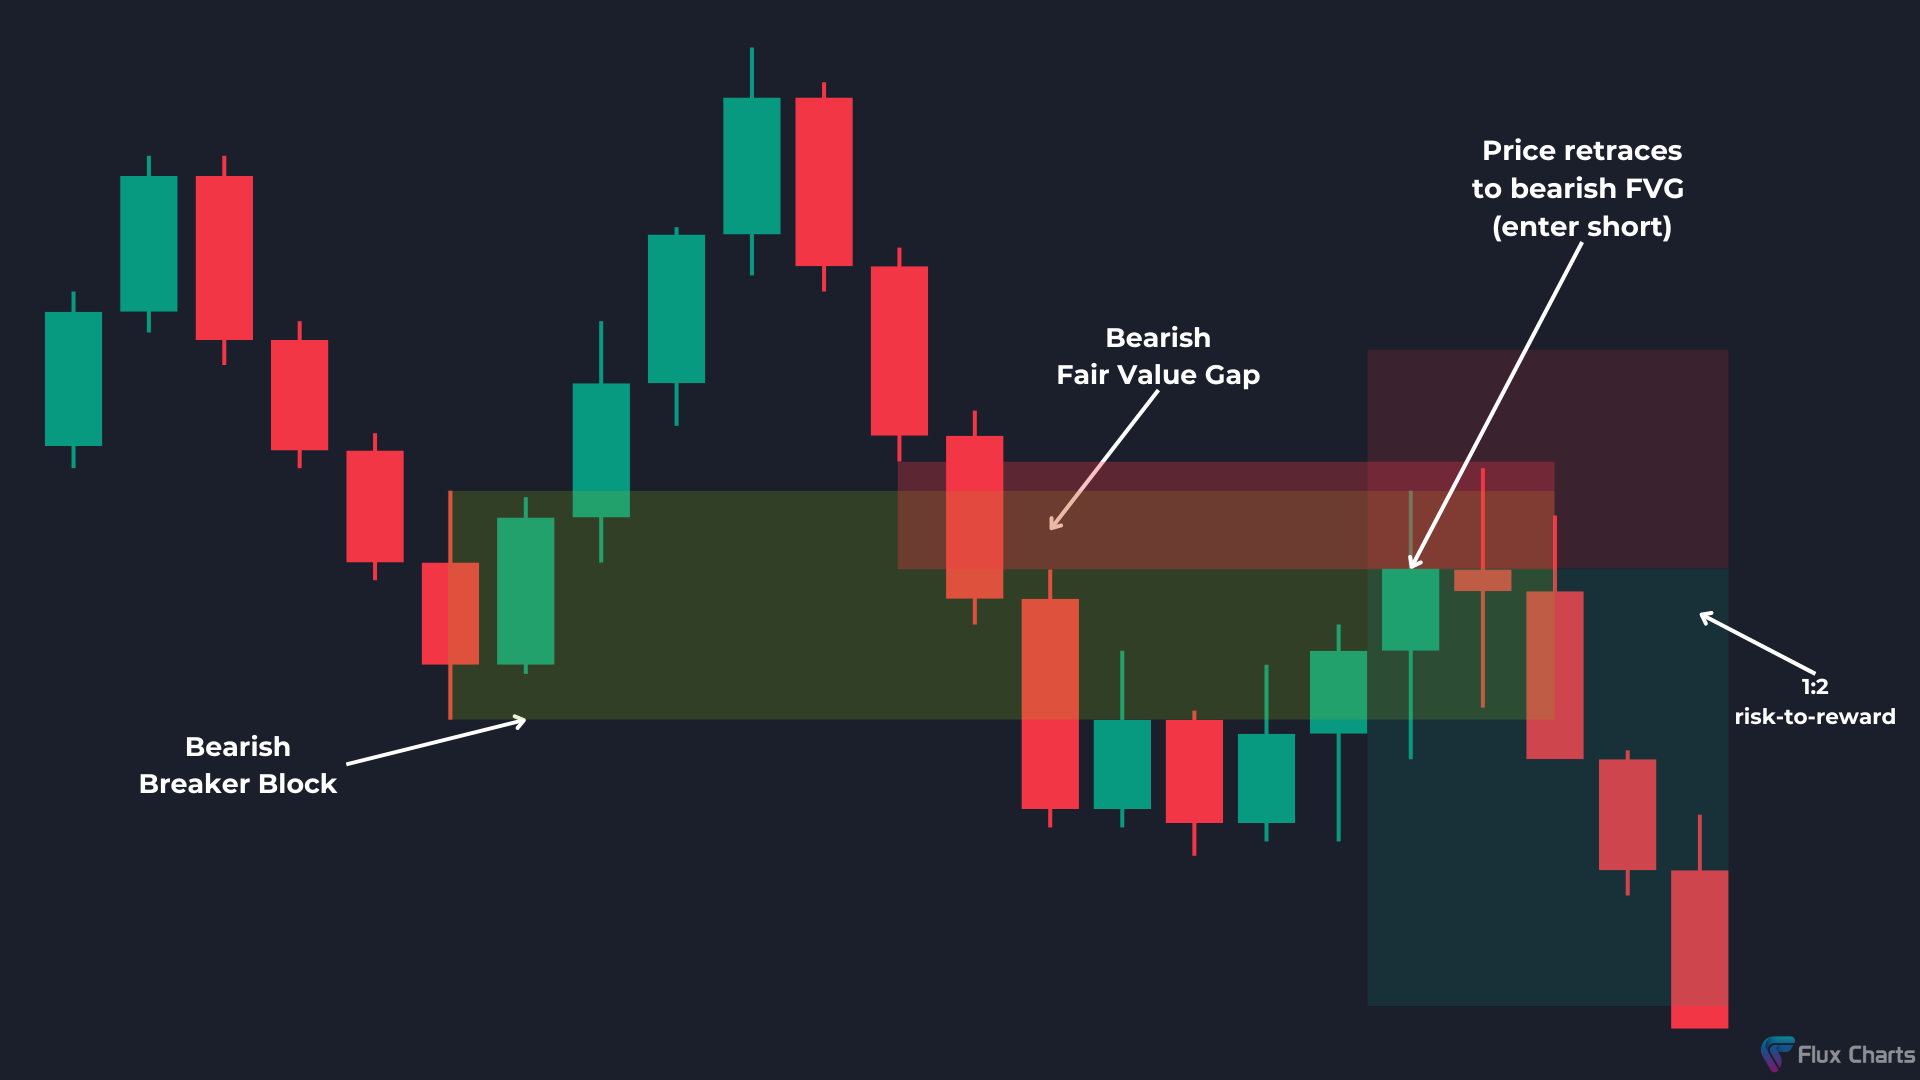
In this example, there was a bearish ICT Unicorn setup: a bearish breaker block with an overlapping bearish fair value gap. Once price retraces to the fair value gap, you can take a short entry, setting your stop loss above the breaker block and taking a 1:2 risk-to-reward ratio trade.
How to Avoid Bad ICT Unicorn Setups
Having 100% accuracy in the markets is impossible, but we can mitigate bad trades by implementing a trade bias. If we have a bullish trade bias, we will only look to take bullish ICT Unicorn setups. If we have a bearish trade bias, we will only look to take bearish ICT Unicorn setups. Since ICT methodology aims to mimic smart money traders or large institutions, we want to always confirm that the setup we are looking at makes sense on a higher timeframe. For example, if we are trading the ICT Unicorn setup on the 5-minute timeframe, we should ensure that we would be looking for long trade opportunities on the 15-minute and 30-minute timeframes as well with the ICT Unicorn strategy. This will increase our likelihood of a winning trade since higher timeframes are also positioned for long trade opportunities.
ICT Unicorn Indicator

We developed and released an indicator that automates the entire ICT Unicorn strategy. The indicator shows you breaker blocks, fair value gaps, buy signals, sell signals, take profit areas, stop losses, and much more. You can also back test everything with the built-in backtesting dashboard. Try it out for free today on TradingView here.
When should I trade the ICT Unicorn?
It's best to trade the ICT Unicorn strategy during periods of volatility. It's recommended to trade this strategy during the New York, London, and Asia sessions.
What timeframe does the ICT Unicorn work best on?
The ICT Unicorn works on all timeframes. However, it's important to use higher timeframes when analyzing your ICT Unicorn setup to ensure you aren't taking trades against the higher timeframe market trend.
How do you backtest the ICT Unicorn?
You can backtest the ICT Unicorn using the built-in backtesting dashboard in the ICT Unicorn indicator by Flux Charts on TradingView.