
How To Identify and Trade Propulsion Blocks

Propulsion Blocks are a trading concept used by price action traders (also known as SMC or ICT traders). Propulsion Blocks are key areas where price has reacted with previous order blocks. Traders can these areas to identify potential reversals or areas of interest in the market.
What Are Propulsion Blocks?
Propulsion Blocks are special price structures where price has reacted off of previous order blocks. They highlight areas where price has previously reacted to significant supply or demand levels. In simpler terms, propulsion blocks are order blocks formed from a reaction off of another order block. These levels can be used to spot turning points in the market or areas of interest. To identify and understand propulsion blocks, you need to understand the concept of Order Blocks. You can read this article to learn how to identify and trade order blocks.
How to Identify Propulsion Blocks?
To identify Propulsion Blocks, you need to first mark out order blocks on your chart. Then, observe these order blocks and watch how price reacts off of them. Remember, propulsion blocks are just order blocks that were formed after price reacted from a previous order block. It’s important to note that when price retests an order block, it should not go above or below the 50% threshold, or the middle of the zone. After price retests the order block and does not go above or below the 50% threshold, price should make a large movement, creating a second order block. This second order block is considered a propulsion block. Check the examples below to understand how to spot a bullish and bearish propulsion block.
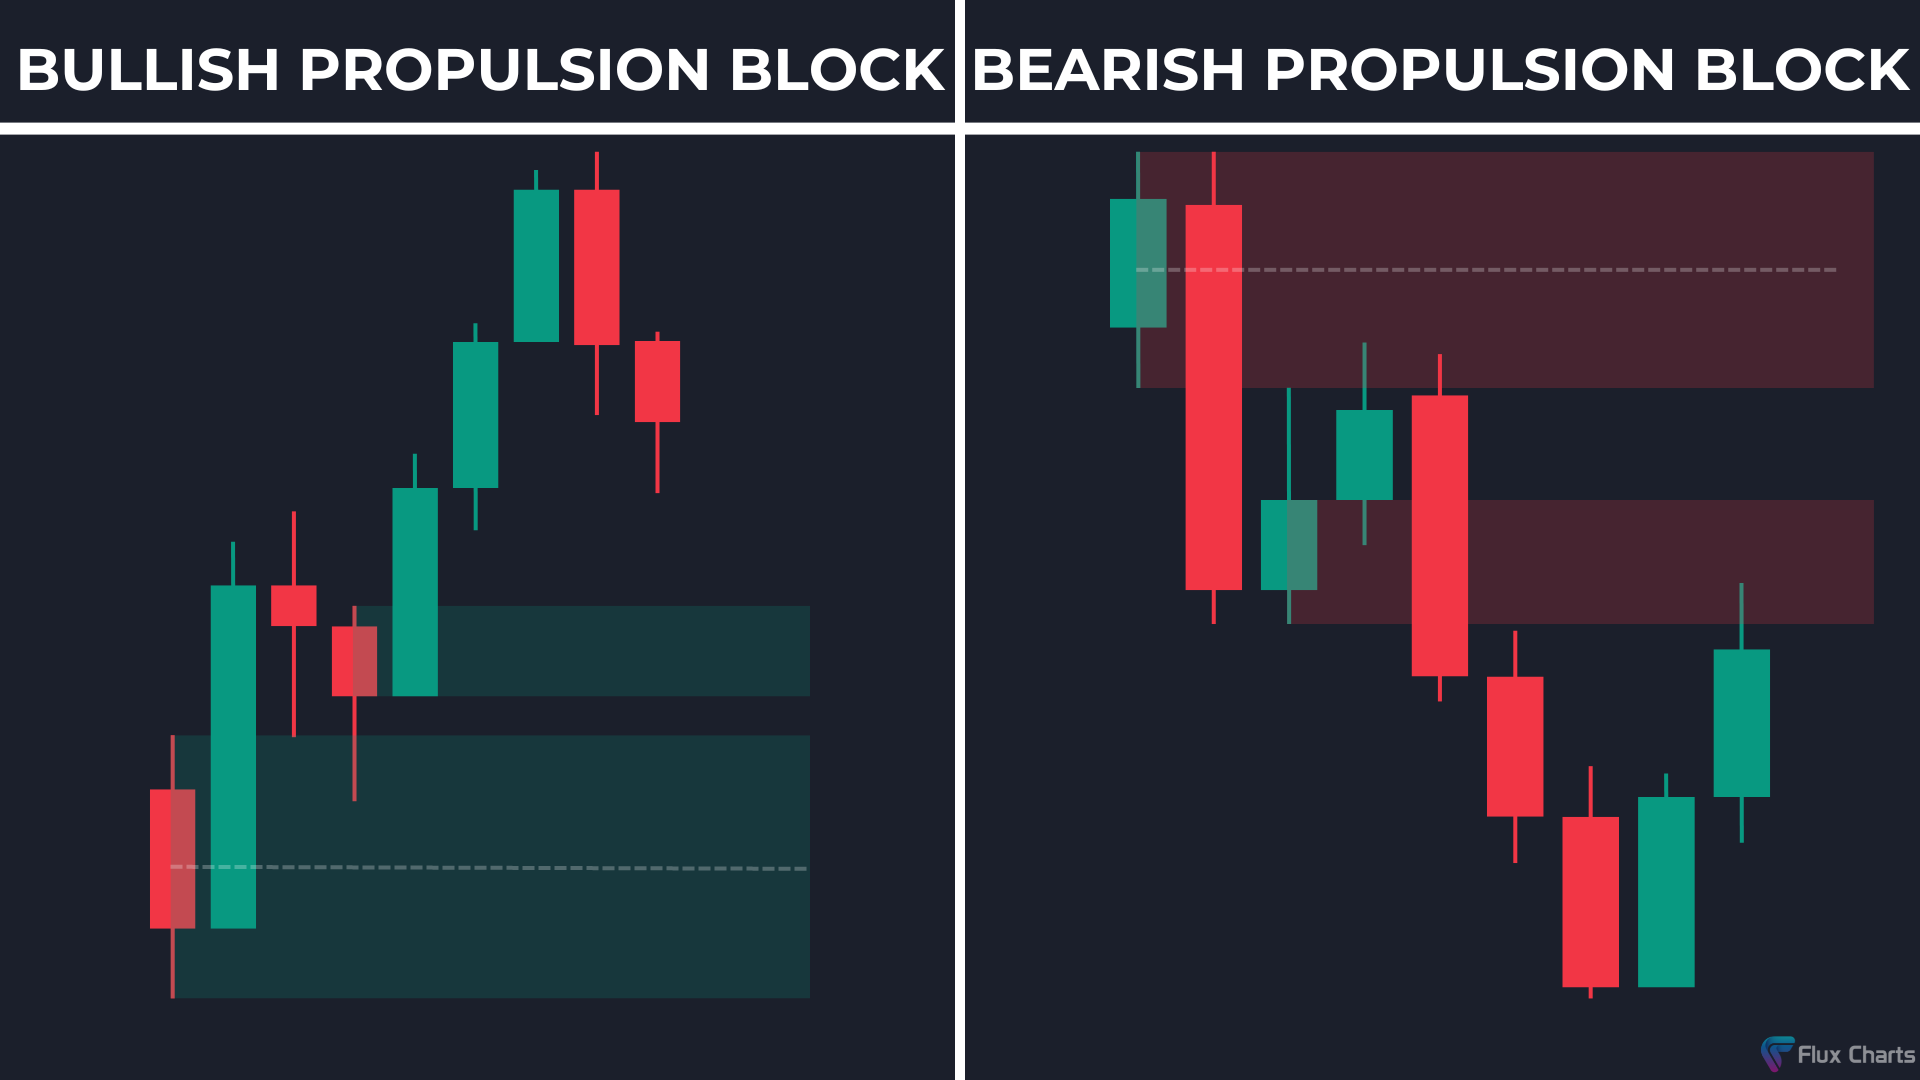
How to Identify a Bullish Propulsion Block

To find a bullish propulsion block, you must first identify a bullish order block. Once you’ve found a bullish order block, wait for price to retest the zone. It is important that price does not go below the 50% threshold level of the bullish order block when retesting it. The candle that retests the order block should jump up quickly, closing above the preceding red candles that approached the order block. This will validate the formation of a new bullish order block, which will now be considered a bullish propulsion block.
How to Identify a Bearish Propulsion Block

To find a bearish propulsion block, you must first identify a bearish order block. Once you’ve found a bearish order block, wait for price to retest the zone. It is important that price does not go above the 50% threshold level of the bearish order block when retesting it. The candle that retests the order block should jump down quickly, closing below the preceding green candles that approached the order block. This will validate the formation of a new bearish order block, which will now be considered a bearish propulsion block.
How to Trade With Propulsion Blocks
Now that you understand the basic concept of Propulsion Blocks, we need to learn how to effectively use them when trading. It’s important to pair propulsion blocks with other forms of confluence such as liquidity grabs, fair value gaps, or technical indicators. If price is approaching a bullish propulsion block, you want to look for long trade opportunities or buys. If price is approaching a bearish propulsion block, you want to look for short trade opportunities or sells. We found a simple, but effective, trading strategy that combines propulsion blocks with the MACD Trail indicator.
Long Trade Example

In this trade example, we combined a bullish Propulsion Block with the MACD Trail indicator to take a winning long trade. Once the bullish propulsion block formed, wait for price to come back down and retest it. Once price retested the zone, wait for the MACD Trail indicator to turn green, or bullish. This will be the trigger to take a long entry. You can place your stop loss below the bullish propulsion block, and take your profit once the MACD Trail turns red. In this example, we were able to catch a 1:4 risk-to-reward ratio trade.
Indicators used in this example:
Propulsion Blocks | Flux Charts
Short Trade Example

In this trade example, we combined a bearish Propulsion Block with the MACD Trail indicator to take a winning short trade. Once the bearish propulsion block formed, wait for price to come back up and retest it. Once price retested the zone, wait for the MACD Trail indicator to turn red, or bearish. This will be the trigger to take a short entry. You can place your stop loss above the bearish propulsion block, and take your profit once the MACD Trail turns green. In this example, we were able to catch a 1:3 risk-to-reward ratio trade.
Indicators used in this example:
Propulsion Blocks | Flux Charts
How Are Propulsion Blocks Formed?
Propulsion Blocks are formed when a candle retests an order block, without crossing above or below the 50% threshold, and then jumps up or down, closing above or below the previous bullish/bearish candles.
What Timeframe Do Propulsion Blocks Work Best On?
Propulsion Blocks work on all timeframes. However, we found that they form more frequently on lower timeframes such as the 1 minute and 5 minute. Thus, propulsion blocks would be better suited for a scalping or day trading strategy.
Can You Solely Trade With Propulsion Blocks?
No, you should not trade Propulsion Blocks by themselves. It's important to pair these zones with other forms of technical analysis. In our examples above, we used the MACD Trail indicator by Flux Charts to add confluence and confirmation to our trade entries.